Overall pesticide usage is trending downward in the U.S., but the findings are more nuanced than that
It’s a tricky trap of wording when discussing the volume of pesticides used in the United States. Endeavoring to swim through the writings of both proponents and opponents alike, it becomes reminiscent of discussions involving the term government subsidies. Much like this term so many have come to immediately associate with all things negative, the term pesticides is actually a bit of a catch-all that tends to sweep in all forms of pest management — from organic to synthetic. That said, organic methods are not documented in the same manner by government agencies irrespective of their toxicity, and so most numbers given in the public refer to synthetics. So when one asks the question, “Is pesticide use up or down in the U.S.?” the answer is simply more complicated than “yes” or “no.”
The term pesticide comes from combining the words pest and -cide, which when combined, mean anything that kills what one considers to be a pest. To this degree, consider these various types of crop protection that:
- Herbicides are designed to kill weeds.
- Insecticides are designed to kill insects.
- Fungicides are designed to kill fungus.
Just because a substance is designed to kill one thing doesn’t mean it is or isn’t lethal to another, and each substance possesses a different level toxicity. If one is looking for a reductive answer to the question of pesticide usage in the U.S., then it’s that overall pesticide usage has been trending down by double digit percentages, with both insecticide and fungicide volumes being down, but herbicide up. These shifts have been directly attributed to the rise in prominence of genetically-engineered (GE) seeds, a trend that has been growing since the 1990s.
Meanwhile, questions concerning toxicity get a similar answer, as the product mixes and application rates vary quite widely. But as with overall usage, the USDA maintains that fewer and less toxic substances are replacing older alternatives due to the changing seed technology and farming practices, such as conservation tillage. Because of the costs involved with purchasing and applying crop protection products, and the stewardship required to keep land and soil functioning, growers are incentivized to be judicious in what kinds and how much of a pesticide product is applied to a farm — in many instances, a pesticide applicator certificate is needed when agricultural commodities are involved.
To dive even deeper into the facts about pesticide use, below is a break-down of U.S. Department of Agriculture data and databases compiled on the topic. Well organized for sure, but just as deep and sometimes difficult to read through, the USDA data does though offer some of the most comprehensive around.
Pesticides By The Numbers
The USDA annually reports pest management practices among producers of nine major field crops, as well as select table crops, through its annual National Agricultural Statistics Service Agricultural Chemical Use Program.
A more comprehensive study was performed in 2014 by the USDA Economic Research Service cataloguing the use of herbicide, insecticide, and fungicide applications for 21 major crops between the years 1960 and 2008. Per that study, Pesticide Use in U.S. Agriculture: 21 Selected Crops, 1960-2008, total pesticide use on crops more than tripled between 1960 and 1981, but then declined from 632 million pounds to 516 million pounds in 2008, a change attributed to more effective ingredients, better pest management, and genetically-engineered seeds that are insect-resistant (Bt) and herbicide-tolerant (HT). That trend as a whole has continued onward yet today.
A 2010 National Research Council study concurred that GE crops lead to reduced pesticide use and to the use of less toxic substances relative to those used on conventional crops. Largely intuitive, it’s not difficult to see why. As a rule, Bt adoption correlates with lower levels of sprayed insecticide, and both U.S. and European studies have demonstrated that areawide suppression of certain insects simply reduce the presence of those insects, much like human vaccines provide an effect known as “herd immunity,” which helps reduce the spread of pathogens even for those who aren’t vaccinated. To that extent, even producers not using the Bt seeds have been shown to benefit from their neighbors’ use, as it reduces the areawide infestation.
The same dynamic has been at play in terms of toxicity. With the introduction of HT seeds in the 1990s, producers have long been substituting the less-toxic glyphosate for the older, harsher materials of yesteryear. Season after season, this has helped protect not only those farms with the weeds in question, but it’s also prevented any potential spread that could have occurred. As glyphosate, which the HT seeds are designed to tolerate, is considered much less toxic and persistent and much more effective, the net impact has been reported as an improvement in overall environmental quality and a reduction in risk to public health.
Considering the combination of new seed technology and better tilling practices, it’s easy to see how much agriculture has changed considerably since the 1980s, and today U.S. cotton, corn, and soybean growers have converted in large swaths to GE seeds. In 2018, the ERS reports 90 percent of those three crop acres planted in the U.S. used HT seeds, with 80 percent of corn and cotton using seeds with Bt traits, created to express one or more of the Bt proteins commercially available and impacted only targeted insects. This shift has resulted in significant reductions in insecticides and fungicides but comparable increases in herbicides as the plants themselves are designed to withstand them.
Table crops have experienced a similar phenomenon. In the 2020 crop year for example, snap bean producers applied herbicides to 94 percent of their planted acres, but insecticides on only 64 percent and fungicides on 55 percent. In terms of herbicides for that year, Bentazon averaged an application rate of 0.561 pounds per acre, with S-Metolachlor at 1.165 pounds per acre. Insecticides surveyed included Lambda-cyhalothrin at 0.039 pounds per acre and Bifrenthrin at 0.075 pounds per acre. Fungicides included Thiphanate-methyl at 1.136 pounds per acre and Chlorothalonil at 1.170 pounds per acre.
» Related reading: 5 things you may not know about pesticides
Meanwhile, for the 2014 crop year, snap bean growers applied an average of 0.955 pounds of S-Metolachlor per acre and 3.271 pounds of EPTC in terms of herbicides. Insecticide application averaged 0.045 pounds per acre of Lambda-cyhalorthrin and 0.124 pounds per acre of Bifentrhin. Fungicide application was 1.398 pounds per acre for Thiophanate-methyl and 0.598 pounds per acre of copper hydroxide.
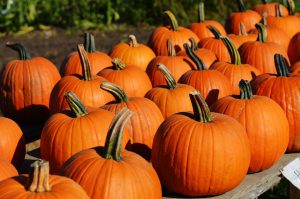
Beyond the major commodity crops, pumpkins offer an example of a crop with downward pesticide trends even in recent years. In 2016, the herbicide Clomazone was used on 57 percent of acres at 0.527 pounds per acre. But in 2020, this fell to 52 percent of acres and 0.460 pounds per acre. Another, the herbicide S-Metolachlor, was applied to 41 percent of acres at 1.244 pounds per acre in 2016, but this fell to 38 percent of acres and 1.088 pounds per acre in 2020. In 2016, the herbicide Ethalfluralin was used on 15 percent of acres at 0.704 pounds per acre. That herbicide use did not register in 2020.
In terms of fungicide applications, the USDA registered 59 percent of acres receiving Chlorothalonil at 4.438 pounds per acre. But in 2020, that application dropped slightly to 58 percent and 4.184 pounds per acre. Copper hydroxide was applied to 34 percent of acres planted at 0.893 pounds per, dropping to 24 percent and 1.041 pounds per in 2020. Meanwhile, the fungicide Azoxystrobin was used across 25 percent of acres planted in 2016 at 0.226 pounds per acre, but its use did not register in 2020.
The ability to maintain production quality and quantity with fewer inputs means so much to land stewardship and to the financial sustainability of growers.
In terms of soybeans, in 2020, herbicides were applied to 98 percent of all planted acres, with fungicides on 22 percent and insecticides on 20 percent. Among herbicides, glyphosate potassium salt was the most commonly used active ingredient applied to 40 percent of all planted acres at an average of 1.566 pounds per acre, followed by glyphosate isopropylamine salt at 38 percent at 1.079 pounds per acre. In 2012, 98 percent of soybean acres received herbicide treatments, with glyphosate potassium salt used on 59 percent and glyphosate isopropylamine salt on 30 percent.
Because soybeans are one of the top U.S. crops, soybean pesticide trends are well documented, with total use leaping from less than 3 million pounds total in 1960 to 146 million pounds in 1982. But between 1985 and 2005 those numbers fell to less than 100 million and bounced back up to just 112 million in 2008, in which year soybean producers accounted for 22 percent of total pesticide pounds applied. In terms of application usage, consider that between 1960 and 1981 herbicide use on soybeans leapt from 0.1 pound per acre to 2.1 pounds, but fell below 2 pounds by 1995 and then 1.07 by 1999 before going back to 1.4 in 2008.
There’s no question the adoption of HT soybeans has increased glyphosate use. Even by 2008, HT seeds were planted on more than 90 percent of soybean acres and glyphosate was the go-to choice with 85 percent of all pounds applied. But that same move to GE seeds has resulted in decreases in other synthetics, hence the overall drop in pesticide use among U.S. farmers.
Plenty to Read for Sure
It’s an interesting topic and hot for debate. With proponents and opponents alike battling over greener technology and the implications of regulations over agriculture, it’s easy to get lost in the generalizations.
Key points to keep in mind include the terminology and then questions of individual active ingredients and potential toxicity for each per application rate. The USDA’s National Agricultural Statistics Service’s Agricultural Chemical Use Program offers a tremendous starting point for those interested on the topic as it affords the public some of the most recent government monitoring data. For those concerned about media spin and advertising hype, these databases focus on active ingredients as opposed to brand names and individual products.
Also, crops grown as part of the USDA’s Certified Organic Program fall under different categories and work with that agency’s National Organic Standards Board and their National List of Allowed and Prohibited Substances. Usage of these products may or may not be documented, and if those estimates were included, it might well demonstrate a significant change in overall materials usage over the years.
Agriculture has certainly come a long way since the ancient Sumerians first developed methods of repelling insects from their fields, and for those interested in health and science, it’s a topic certain to remain relevant so long as humans need to eat.
Brian Boyce is an award-winning writer living on a farm in west-central Indiana. You can see more of his work at http://www.boycegroupinc.com/.