With trade wars, shaky markets, natural disasters and an ever-changing consumer demographic, there’s been a lot of speculation on the changes within our livestock industry since the 2012 USDA Census of Agriculture. The wondering is over — the 2017 numbers are officially in and available to the public. How do these numbers reflect the changes and tides of the industries through our most recent years? This summary will give you a glimpse of our current state of affairs.
Overall
2017 closed with some slight increases in terms of the market value of livestock and poultry sold, both live and products. Products sold was up to just about $200 billion total, moving up from 2012 where the grid fell just below this mark. Likewise, livestock and poultry purchases were also up according to the selected farm production expense report breaching approximately $45 billion dollars, as opposed to around $42 billion in 2012. Seems decent at a glance, but each individual industry and the multiple segments within each tell their own stories. It is important to note that these values by no means speak to the profitability of individual operations.
Cattle
Individual beef operations of all sizes are up by 1,140 in 2017 compared with 2012. National herd size also increased, more so than we’ll see on the dairy side, going up an impressive 31,722,039 head from 28,956,553 head per the prior census.
As expected, dairy farms have gone down substantially as the result of a challenging dairy economy in recent years. The 2012 census recorded a total of 64,246 individual dairy farms. At the end of 2017, there were only 54,599 accounted for, with many more having exited the industry since. Cow numbers, while not seeing as much of a difference as the beef industry, have held their own and moved up to 9,539,631 head from 9,252,272. This reflects the industry trend of less individual farms but those remaining having larger herd sizes.
Hogs
Hog operations and herd size have both seen some considerable growth. The USDA reported a 3,193 farm increase from 2012, along with a growth of 6,354,222 head in the national herd size.
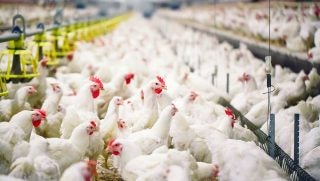
Poultry
Following a similar trend as the pork industry, the main poultry markets have also seen a growth in farm and animal numbers. Layer operations moved up to 232,500 from 198,272. National flock size has also held pretty stable at a size of 368,241,393, up about 18 million from 2012. Broiler farm sizes dropped ever so slightly but come to a grand total of 32,751 by the end of 2017 with a national flock size of 8,889,759,283. Turkey farms saw an increase of 3,217 operations and an increase by 3,530,511 birds.
Small Ruminants
Inventory numbers show a growth in the small ruminant industries, namely sheep and goat production. A lot of this can be attributed to the increase of ethnic populations driving a demand for their products. Some experts also point to these being ideal “retirement farm” projects that can still bring in a respectable income. In 2012, there were only 88,338 reported sheep farms and 128,456 goat farms. By the end of 2017 there were 101,387 sheep farms and 136,442 goat farms. Notably, the national sheep herd moved up by 26,408 head and the goat herd by 77,122 head. These industries are expected to increase and remain profitable for the foreseeable future.
Equine
Horses and ponies went down between the two censuses. National herd size went down by 774,059 head and saw a decrease of 45,269 farms. Interestingly, mules, donkeys and burros moved went up 18,747 farms and 24,973 head in the national herd size.
Jaclyn Krymowski is a graduate of The Ohio State University with a major in animal industries and minor in agriculture communications. She is an enthusiastic agvocate, professional freelance writer, and blogs at the-herdbook.com.