People love infographics. They are easy to read, easy to understand, and easy to share — especially with a lot of data. People usually prefer infographics over spreadsheets and text.
But is it hard to create an infographic? Not anymore.
Canva is one of the best online image and graphic tools on the internet. There are several others, such as Vennegage, Crello, DesignBold, Pikochart, Infogram, Visually, and Mind the Graph, but Canva is one of my favorites because of its ease of use and lots of graphic elements. You can sign up for a free account at canva.com.
So how do you create an infographic?
The first thing to do is gather your data and determine what is most important for your audience to understand.
When it comes to dairy farms, consumers want to know a few things.
- Are the dairy cows healthy?
- Is the milk safe?
- Are the environment and natural resources well-taken of?
What kind of data do you collect on the farm that can be easily understood by a consumer?
For instance, let’s focus on the first question: “Are the dairy cows healthy?”
Maybe use these data points:
- We use a dairy nutrition specialist to balance our cows’ diet. Alfalfa hay, cotton seed, canola meal (byproduct of cooking oil), ground corn, protein vitamin mineral pack (dairy nutrition)
- A dairy veterinarian checks the cows frequently.
- Each cow is milked twice a day for only 5 to 7 minutes on the machine at a time.
- We use radio-frequency identification tags to track their milking to make sure she’s healthy.
- A typical day for a cow is this: eat for 6 hours, travel/interact for 4 hours, lay down/rest/sleep for 14 hours and get milked 15 to 20 minutes a day.
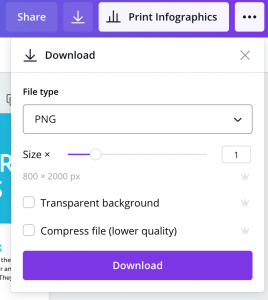
You now have information ready to be converted into an infographic. If you are using Canva, you would follow these steps:
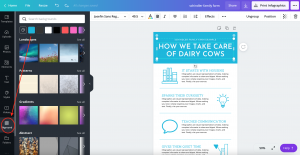
1. Choose an infographic template.
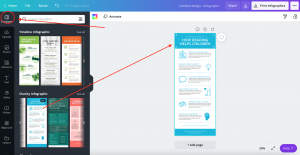
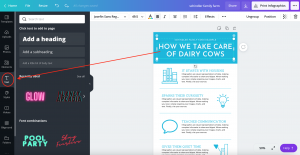
2. Choose the background.
3. Choose the fonts.
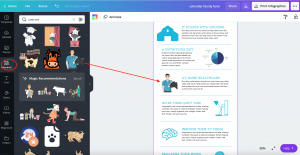
4. Add graphic elements.
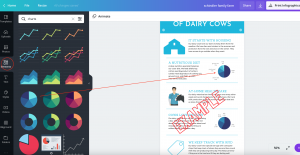
5. Add charts.
6. Download your file to png or pdf.
Here’s the example that we created.
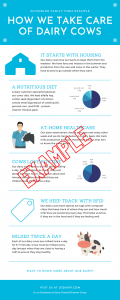
The result is something wonderfully simple and effective to convey information about your farm and your production methods to others.
To learn more about your national dairy checkoff, visit www.USDairy.com or send a request to join our Dairy Checkoff Facebook group.