This article was written by Dan Manternach, president of Perfect Fit Presentations, and was originally published in the July newsletter of the Iowa Chapter of the American Society of Farm Managers and Rural Appraisers. It is republished with permission.
Precision ag technology began in the early 1990s with widespread use of yield monitors in combines that would generate maps of fields based on the grain flow into the hopper as the machine moved up and down the fields. Early adopters of precision ag technology were often described as being on the “bleeding edge” of adoption because the costs so often exceeded any measurable increase in profitability.
That’s no longer the case. In fact, Forbes magazine ran a 2019 feature with the headline: “By Raising Productivity, Ag Tech Boosts the Value of Farmland.”
In that article, Bill Lapp, president of Omaha-based Advanced Economic Solutions, noted, “Widespread adoption of technologies that have increased output per acre, as well as reducing production costs, have been the primary catalyst for rising land values in the U.S. and globally.”
The technology has advanced so far that actual field data from farmers participating in the FINBIN program headquartered at the University of Minnesota can now be sorted into those aggressively using precision ag tech and those who don’t and then compared for differences in yields, income, variable costs, fixed costs, and returns. FINBIN covers all major farm crop and livestock enterprises; I chose soybeans for example purposes.
First, I defined “aggressive users” of precision ag tech as those FINBIN participants utilizing four specific PA technologies: data from yield monitors the prior season to guide variable rate planters, variable rate fertilizer applicators, variable rate chemical application, and auto-steer guidance technology. Then, I compared FINBIN participants using those four technologies in their soybean production to a separate sort of FINBIN participants who didn’t use any of them in their 2019 soybean production.
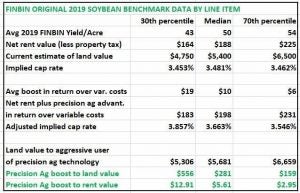
Figure A below uses 2019 data from FINBIN benchmark reports for soybeans among all 12 participating states (MN, IL, WI, MI, MO, NE, ND, SD, OH, SC, PA, UT). I did not use the benchmark report for all 2,087 participating producers submitting their data for the 2019 soybean crop. They were sorted into two groups. Figure A data is derived only from 581 of those participants we sorted out as aggressive users of precision ag and compares it to the same metrics among the remaining 1,506 participants who used none of those four listed technologies.
While the FINBIN benchmarks data into separate percentiles in 10-point increments, I chose just three for both groups I sorted out: Those in the 30th percentile or lower, those at the median (where half were better and half were worse) and those at the 70th percentile or higher. Among the key findings?
- Precision ag users generally averaged 2.5 to 3 bu./acre more than non-users on land of similar quality based on rent value.
- Precision ag users generally averaged lower variable costs per acre than non-users.
- Precision ag users generally had greater returns over variable costs ranging from $19 per acre among those in the 30th percentile, to $10 per acre among those at the median, to $6 per acre among those in the 70th percentile.
More evidence precision ag will boost land values:
Early this year, the Agricultural Data Coalition, a nonprofit organization focused on connecting the data dots across food and agriculture, polled farmers to learn 1) the current extent of PA use among farmers; and 2) where farmers thought future advances might bring. Among findings, 58% already think an extensive database on how their land has been monitored and spoon-fed just what’s needed for maximum profitability will increase their land value compared to similar land without such data to show potential buyers.
How increased profitability translates to higher rent value or land value:
A common measure of land value is tied to what’s called the capitalization rate or “cap” rate derived by dividing average rent value (less property taxes) by the asking price.
Going back to Figure A above, I compared increased returns over variable costs by those aggressively using those four elements of PA to those who didn’t use any of them. Next, I estimated the 43 bu/acre ground in the 30th percentile, with a net rent value of $164 in the FINBIN data, to be worth $4,750 per acre. I estimated the median yield of 50 bu/acre with net rent value of $188 per acre to be worth $5,400 and the 54 bu/acre ground commanding net rent of $225/acre to be worth $6,500/acre.
Finally, I added the boost in returns over variable costs among those aggressively using precision ag technology to the FINBIN net rent value and re-calculate the capitalization rates accordingly. Finally, I re-evaluate the value of the land to the aggressive precision ag user using the improved capitalization rates.
The Figure A lines in green tell the story: That $4,750 land in the 30th percentile is actually worth $556 more to a precision ag wiz. That same land is also worth bidding an extra $12.91 an acre just to rent it. At the “median” level, precision ag adds $281 to the value of the $5,400 land for the precision ag wiz, and raises the bid to rent it by $5.61 per acre. Among the high performers in the 70th percentile among both groups (PA users and those who don’t use it), the precision ag advantage raised the value of the $6,500 land by $159 per acre and raises its value as rental ground by $2.95 per acre.
Two summary conclusions:
1) The evidence that precision ag makes land more productive and profitable clearly translates into higher rent value and market value for farmland to aggressive users of precision ag.
2) The fact that less than 30 percent of the soybean producers participating in the 2019 FINBIN program met my definition as “aggressive users” of precision ag tech is important. Why? It means they also have a significant competitive advantage.