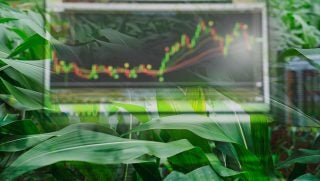
Precision farming is agriculture at its finest, and honing the imagery and data collected from aerial photography can help give you a window into your field crop’s health. The proprietary and patent-pending technology employed by Airscout can show farmers where the problem areas are and even what their field is likely to average during the growing season.
Brian Sutton created the Lowell, Indiana-based Airscout after exploring the best methods of field scouting — it’s critical to avoid crop diseases that can devastate an operation’s profitability. The fifth-generation farmer has been flying planes since he was 13 and has spent much of his life scouting fields. He spent the better part of the past decade on research and development of Airscout’s tools and technology.
“While ground scouting is essential, Brian’s family knew well that at certain times of the growing season it just wasn’t possible to adequately assess plant health from the ground, given stalk height and canopy growth,” the company says on its website. “And, it is often at just that time that the crop may be most vulnerable — a time when the opportunity for intervention is narrow and the window for replant is closed.”
What Sutton also thought was lacking was precision in traditional NDVI camera imagery — the kind that’s housed on many of the drones seen in commercial agriculture. After all, Sutton will tell you that the detail in NDVI images doesn’t reveal much more than what can be seen with the naked eye. Airscout has multiple image types at its disposal — thermal imaging that helps in identifying diseased areas, Advanced Digital Vegetation Index imaging that shows hungry (usually nitrogen depletion) areas, and standard aerial imagery.
The thermal image technology shows temperature differences in a given field and doesn’t depend on reflected light from the sun and can even be used at night. Airscout’s thermal technology differs from NDVI maps of the past, which were set up to show a scale of variation in temperature rather than an actual measure of temperature. “Our thermal camera … shows actual emitted energy from plants. Because it shows the emitted energy, we can see disease or stress in a plant long before it begins to change color,” Sutton says.
ADVI, on the other hand, shows color differences (the algorithm for the ADVI changes 256 shades of both green and brown), giving a level of detail and patterns that is unsurpassed. ADVI uses modern camera capabilities to yield greater resolution and better capability to stratify the color spectrum, allowing more subtle, but important diagnostic distinction. Each pixel is scored with a specific and distinct numeric value. The values are then mapped to crop health and are capable of greater pinpoint assessment and treatment.
Maykol Hernandez, vice president of international operations, says that both the thermal and ADVI images are of value to clients. “For example,” he says, “at the beginning of the season we look at the entire field as having equal opportunity of growth, everything planted at the same day with sometimes the same hybrid and having the same weather to deal with. Yet, every year is a bit different, mostly due to weather changes. But we use our imagery to monitor the crop. At the beginning of the season we look for our best bares soil image (either our ADVI or thermal image) to build a planting prescription. At this time of the season, we use our canopy image looking for our healthy areas versus our unhealthy areas in the field. Then we use our ADVI image to build a nitrogen prescription that is incorporated inside our Airscout system. The software breaks out into equal areas ranging from high vegetation areas to low vegetation areas.”

Airscout punctuates its technology with a free app available via Apple’s App Store. The app can be used to zoom in or delete images, check image information, change which image types and image versions are being studied, and export images as emails or printouts. Thermal imaging can be overlaid onto a Google Maps image. The heart of it is accessibility and long-term monitoring. For example, after combining, you can take a photo of your yield monitor and import that image into the mobile app to help catalog a vision of the entire season.
“We also have the yield estimator tool to help the clients navigate to specific locations (using the thermal image) where they find the worst, medium, and best part of the field. At those locations they run a yield estimate and plug it into the Airscout web and get an overall average of the entire field. At the end of the season they can use the thermal image to look for disease areas, having the option to spray a foliar or fungicide with our variable rate prescriptions,” Hernandez says.
The company covers 16 states and part of Canada. “We feel that by using this technology in conjunction with a high clearance applicator or aerial application service, the grower can deliver rescue nitrogen treatments where needed in addition to taking corrective action for disease or pests,” Sutton says.
Want a peek at Airscout’s mobile app? Check out the video below.
Images courtesy of Airscout