The U.S. Department of Agriculture’s plant hardiness zone map was updated last week for the first time in a decade. Gardeners and growers alike may have been unsurprised to find that many plants that once may have been hampered by frosts can be grown in areas once thought unfit for less frosty hardy species across the country.
The culprit? Uneven warming temperatures across many regions and more sophisticated mapping techniques. The 2023 map is about 2.5 degrees Fahrenheit warmer than the 2012 map across the United States. However, half of the country has shifted to a warmer 5-degree half zone. And half remained in the same zone.
“The addition of many new stations and more sophisticated mapping techniques using the latest PRISM technology led to a more accurate and detailed Plant Hardiness Zone Map but also produced localized changes that are not climate related,” writes Christopher Daly, director of the PRISM Climate Group and the map’s lead author.
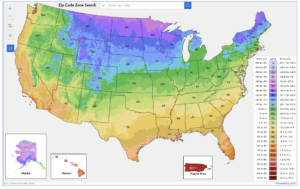
The USDA Plant Hardiness Zone Map is the standard by which gardeners and growers can determine which perennial plants are most likely to thrive at a location. The map is based on the average annual extreme minimum winter temperature, displayed as 10-degree F zones and 5-degree F half zones.
The plant hardiness map is divided into a total of 13 zones, each zone representing a 10-degrees-Fahrenheit range of temperatures. Each zone is further divided into two half zones, with each of those representing a 5-degree range.
Along with the new map is a “Tips for Growers” feature that helps growers to find Agricultural Research Service programs that may be helpful.
According to the USDA, approximately 80 million American gardeners and growers are the map’s most frequent users. The USDA Risk Management Agency also utilizes the map in certain crop insurance standards. Scientists also incorporate plant hardiness zones into research models, including those that look into the spread of exotic weeds and insects.